
How to Track Event Ticket Sales Online: 2026 Guide
Table of Contents
- Why Tracking Ticket Sales Beats Checking the Count
- What You Need Before You Start Tracking
- Step 1: Set Up Real-Time Sales Tracking and Notifications
- Step 2: Connect Your Marketplace and Distribution Channels
- Step 3: Use Event Ticketing Software Analytics to Read the Numbers
- Step 4: How to Analyze Event Registration Data Without Guesswork
- Tracking Event Marketing ROI by Channel
- Mistakes That Wreck Your Sales Data
- The Bottom Line on Reading Your Numbers
- Frequently Asked Questions
Last Updated: September 27, 2026
Why Tracking Ticket Sales Beats Checking the Count
Knowing how to track event ticket sales online is the difference between guessing and running a real business. I’ve watched too many promoters refresh a sales page and call that “monitoring.” That’s not tracking. That’s hoping.
At Reach LA Angels, we’ve spent years helping local creators get their events in front of the right people. The ones who grow fastest? They watch their numbers like a hawk. They know which channel moved tickets and which one just made noise.
Here’s the truth most guides skip: a ticket count tells you what happened.
What You Need Before You Start Tracking
Get your foundation right before you touch a dashboard. Most organizers skip this and wonder why their numbers never add up.
You need four things:
- One place to sell. Pick a primary ticketing platform so your main data lives together.
- A unique link per channel. Every post, email, and flyer gets its own trackable link.
- A spreadsheet or dashboard. Somewhere to pull it all together.
- A daily check-in habit. Ten minutes, same time, every day.
That’s it. No fancy setup required.
Give every distribution channel its own link, even your group chat. When a channel has no link, it has no accountability. You’ll never know what actually sold tickets.
Step 1: Set Up Real-Time Sales Tracking and Notifications
Real-time tracking means you see sales as they happen, not the next morning. That speed lets you react while it still matters.
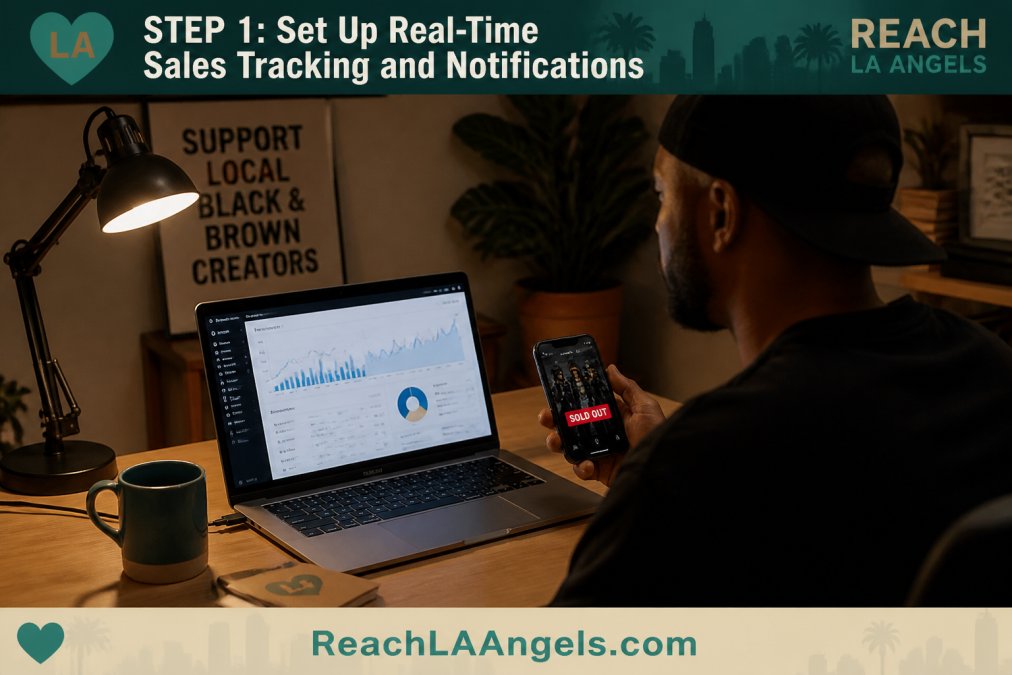
- Every sale (yes, every one at first)
- Sales milestones, like half capacity
- Sudden spikes or stalls
- Refund requests
Price Alerts and Sold-Out Notifications
Set a sold-out alert before you need it. When your last block of tickets moves fast, you want to know instantly so you can plan a waitlist or a second date.
Step 2: Connect Your Marketplace and Distribution Channels
Your tickets sell in more than one place. Connect every channel so your data tells one story.
Map out where you’re pushing:
- Your main ticketing platform
- Social media posts and stories
- Email blasts
- Community partners and local promoters
Step 3: Use Event Ticketing Software Analytics to Read the Numbers
Event ticketing software analytics is the practice of pulling sales, traffic, and attendee data from your platform to see what’s actually working. It turns raw transactions into decisions.
Open your analytics and focus on four numbers first:
| Metric | What It Tells You | Watch For |
|---|---|---|
| Sales velocity | How fast tickets move | Sudden slowdowns |
| Conversion rate | Views that become sales | Low rates = weak page |
| Revenue tracking | Money in by tier | Which tier carries you |
| Traffic source | Where buyers came from | Channels that earn |
Read Velocity as a Curve, Not a Number
A single velocity number is useless. Plot sales per hour across the life of the campaign and you’ll see a shape. Three shapes matter:
- Front-loaded spike, then flatline. Your core community bought early. The general audience never showed up. Push a second creative wave.
- Slow burn that climbs. Word of mouth is working. Feed it, drop a teaser, tag your partners, let the community carry it.
- Stair-step jumps. Each jump lines up with a specific post or partner push. That’s your proof of what moves tickets.
Benchmark Conversion Against Your Own History
Industry conversion benchmarks vary too widely by event type to trust as a target. Your own past events are the only honest benchmark. Track view-to-checkout rate for every event you run. If this show converts at half the rate of your last one, the problem is the page, the price, or the offer, not the audience.
Visualize the Trend, Don’t Just Read the Table
Raw tables hide patterns. Two moves fix that:
- Velocity chart. Sales per hour on a line graph. You’ll spot the stall before it becomes a problem.
- Channel conversion chart. Bar chart of conversion rate by traffic source. The winner is rarely the channel with the most clicks.
If your platform doesn’t chart these natively, export the CSV and build them in a spreadsheet. Ten minutes of setup pays for itself on the first event.
Pull Data Into Your Own Dashboard
If you run multiple events or multiple brands, your platform’s dashboard isn’t enough. Most major ticketing platforms expose a REST API that lets you pull sales, orders, and attendee records into your own tools. The pattern is the same across platforms:
- Generate an API key in your account settings.
- Authenticate with a bearer token.
- Pull orders on a schedule, hourly is plenty for most events.
- Push the data into a spreadsheet, a BI tool, or a simple internal dashboard.
Start with the API docs your platform already publishes. You don’t need a developer for a basic pull, a scheduled script and a spreadsheet will do the job.
Step 4: How to Analyze Event Registration Data Without Guesswork
Learning how to analyze event registration data comes down to one habit: compare, don’t assume.
Reconcile Sales After the Event
Post-event reconciliation is the audit that tells you whether the numbers you watched all week were actually true. Do it within 48 hours while the details are fresh.
Pull three reports side by side:
- Platform sales report. Every order, every tier, every refund.
- Payment processor report. What actually cleared the bank.
- Door and check-in report. Who actually walked in.
Then answer four questions:
- Do platform sales match processor deposits? If not, you have refunds, chargebacks, or fees eating the gap.
- Do paid orders match check-ins? No-shows are a real cost, they bought a seat someone else couldn’t.
- Did any tier oversell or undersell against your plan? That’s your pricing signal for next time.
- Which channel’s buyers actually showed up? A channel that sells but doesn’t convert to attendance is a channel you’re paying for twice.
Screen for Fraud Before It Hits the Door
Tracking sales is one thing. Verifying the buyers are real is another. Fraud in ticketing shows up in patterns, not single orders:
- Bursts of orders from one IP or device. Real audiences don’t buy 40 tickets in 90 seconds from the same source.
- Mismatched billing and attendee info. A card from one region, an attendee list from another, no history between them.
- Disposable email domains. Not proof on their own, but a flag when paired with the above.
- Resale listings appearing before your event sells out. That’s a scalper signal, not a fan signal.
Don’t judge a campaign by total sales alone. A channel can bring big numbers and still lose money if those buyers refund, charge back, or never show. Track refunds, chargebacks, and check-ins alongside sales, and reconcile them after the event, not just during it.
Turn the Post-Event Read Into Next-Event Strategy
The reconciliation isn’t paperwork. It’s your playbook. Every no-show rate, every channel that under-delivered, every tier that priced wrong, that’s a decision you get to make better next time. Run the audit, write down three things you’d change, and bring them into your next campaign brief.
Tracking Event Marketing ROI by Channel
Tracking event marketing ROI means matching what you spent on each channel to what that channel sold. Simple math, big clarity.
For each channel, note:
- What you spent (ads, promo, partner cuts)
- Tickets sold from its unique link
- Revenue from those tickets
Mistakes That Wreck Your Sales Data
The biggest mistake is tracking in too many places with no single source of truth. Your numbers stop matching, and you stop trusting them.
Other common slips:
- No unique links, so you can’t credit any channel
- Checking numbers once a week instead of daily
- Ignoring refunds and no-shows in your totals
- Letting a sold-out tier sit without a waitlist
One source of truth, unique links per channel, and a daily check-in. Nail those three and your data stays clean.
The Bottom Line on Reading Your Numbers
Tracking isn’t busywork. It’s how you protect your time, your money, and your community’s trust.
Frequently Asked Questions
What is the best way to track ticket sales from specific promotional channels?
Use unique links or codes for each channel, then compare how many tickets each one moves. Most platforms let you create multiple tracking links for the same event, so an Instagram post, an email blast, and a partner shout-out each get their own tag. After a few events you will see which channels actually sell tickets and which just make noise. That is how you know where to put your energy next time.
How can organizers use sales data to adjust marketing strategies mid-campaign?
Watch your sales velocity in the first 48 hours after a push. If a channel is flat, shift your effort to the one that is moving. If a price tier is not selling, promote that tier directly instead of discounting everything. Real-time analytics let you make those calls while tickets are still on sale, not after the event is over. Small mid-campaign adjustments often matter more than big last-minute discounts.
Is it better to use platform-native dashboards or third-party tracking tools?
Start with the dashboard inside your ticketing platform. It already has your sales, check-ins, and refunds in one place. Add a third-party tool only when you sell across multiple platforms or want custom reports the native dashboard cannot build. The goal is one clear view of your numbers, not five tabs you never open. If your platform’s analytics cover your needs, keep it simple and stay there.
What metrics matter most when monitoring event registration?
Track conversion rate, sales velocity, and where each ticket came from. Conversion rate shows how many visitors actually buy. Sales velocity shows how fast tickets move after each promotion. Source data shows which channel deserves your time. Together those three tell you if the problem is your reach, your message, or your price. Check-in rates after the event close the loop on whether your marketing brought the right crowd.
Reading your sales data is the easy part. Getting your event in front of the right crowd is the hard part. Reach LA Angels was built for that second job. We put your event in front of Angelenos who value authentic cultural experiences, with curated listings and promotion that speak to our community. Post your event on Reach LA Angels and let your numbers do the talking.